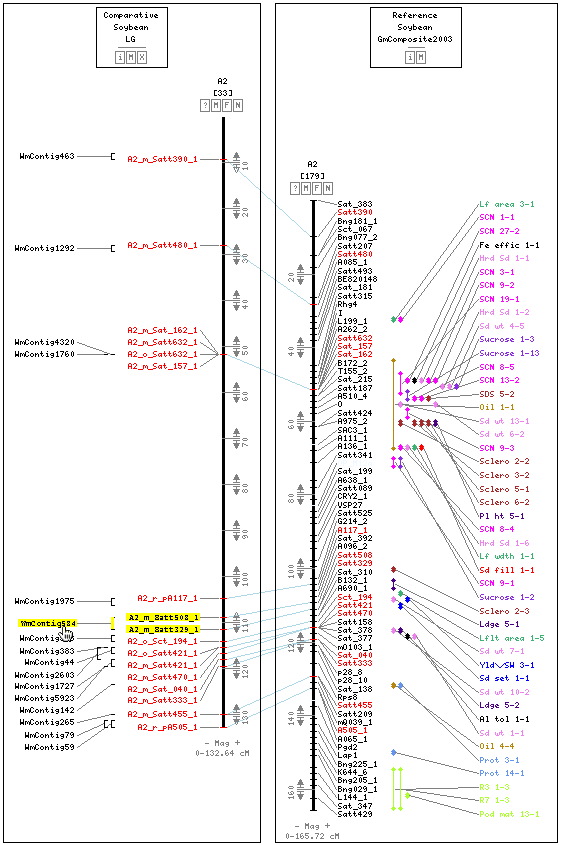
Markers on the physical map have been renamed to indicate their linkage group and the method used to associate them with a contig. Complete details on the nomenclature can be found here.

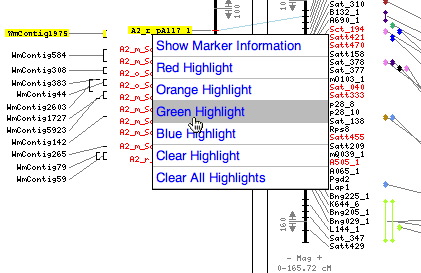
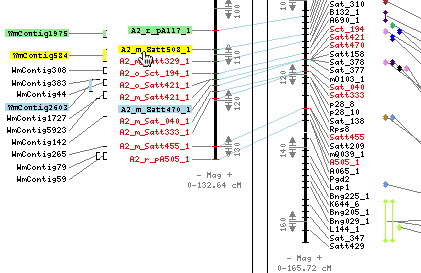
Moving the mouse over a BAC or marker highlights all related map objects. In this example putting the cursor on the contig WmContig584 highlights the markers on the genetic map that anchor it.
Markers on the physical map have been renamed to indicate their linkage group and the method used to associate them with a contig. Complete details on the nomenclature can be found here.
| A1_o_Satt165_1 | overgo derived from the SSR marker Satt165 associated with BACs by hybridization (membranes contained BACs from both the GMW1 and GMW2 libraries) |
| A1_p_Satt449_1 | SSR marker associated with a BAC using the UMC 6D pools (only BACs from the GMW2 library) |
| A1_m_Satt364_1 | SSR marker associated with a BAC using the ISU BAC superpools (only BACs from the GMW1 library) |
| A1_r_pB172_1 | RFLP marker associated with a BAC by hybridization using the ISU BAC superpools (only BACs from the GMW1 library) |