Integrating Genetics and Genomics to Advance Soybean Research
The hierarchical clustering method clusters genes into clades with similar expression profiles. The three groups of genes below: Data S1, Data S2 and Data S3 are the genes that showed a significant increase in gene expression in one of three tissue groups: Seed, Aerial or Underground. Clicking on the small thumbnail switches between the three data sets. Within a given data set clicking on the preview window permits quick exploration of the hierarchical clustering dendrogram (tree graph). Finally, Clicking on a gene name will take the user to the gene in the soybase genome browser. If you prefer you can download this data and view it in pdf format.
Data S1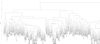 Seed |
Data S2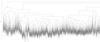 Aerial |
Data S3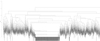 Underground |
| Funded by the USDA-ARS. Developed by the USDA-ARS SoyBase and Legume Clade Database group at the Iowa State University, Ames, IA | ||
|
|

|
|
